


CMP Debugger Console
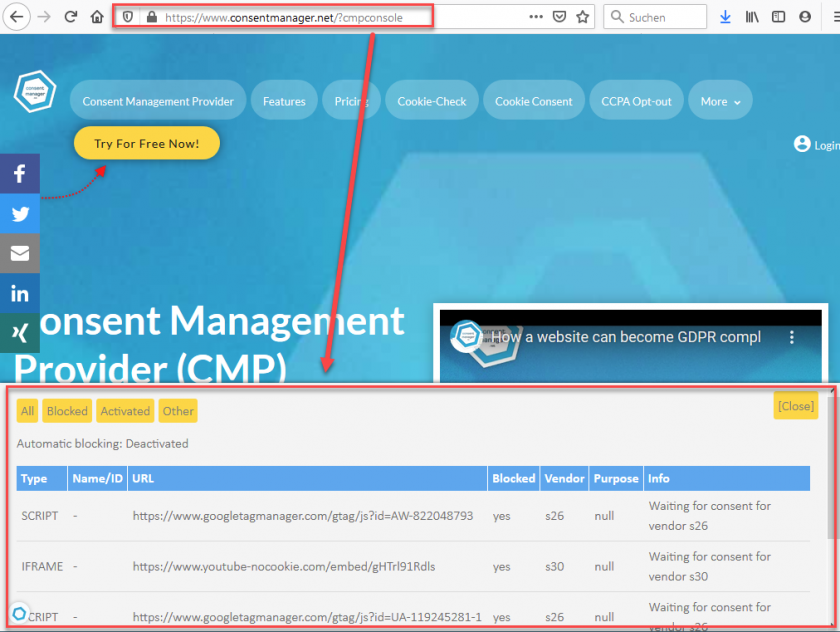
In order to enable developers with a better view on what the CMP is doing regarding code blocking, developers can use the debugger console. In order to enable the console, simply add ?cmpconsole to the end of the url that you are viewing in your browser and refresh the page:
If you cannot refresh the page, you can also execute window.cmp_loadconsole() in the Developer console of your browser.
How to find out why Scripts are not working?
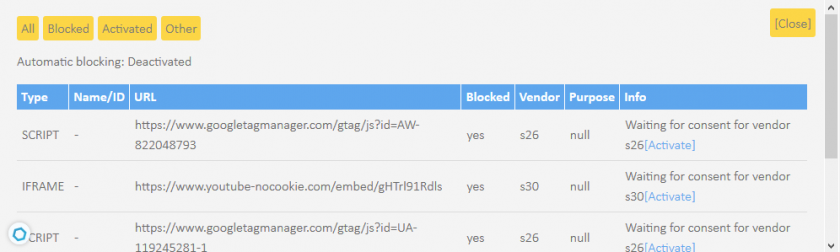
The console will show you all elements (scripts, iframes, images, ...) in the page that are blocked, activated (unblocked) or ignored. For all elements you will see the vendor that has been identified for this element, the purpose and an info text.
The following status messages can be found:
| Status | Description |
Activated |
The element was blocked but is now unblocked and loaded |
Searching for vendor |
The element needs to be analyzed. The system is currently searching for the vendor. Click on the list again after some seconds in order to see the latest status. If the status continues, this means the vendor could not be identified (see below). |
|
|
Ensure that the vendor is listed in your vendor list (Menu > Vendors). If the vendor is a custom vendor (IDs starting with "c"), you will need to tell the CMP that this script belongs to the vendor by adding data-cmp-vendor="c123" (where c123 is the vendor ID) to the script. |
Waiting for consent for vendor xxx |
The element belongs to vendor x but the visitor has not yet given consent to this vendor. |
Not prepared for blocking: ... |
A system rule prevents the CMP from blocking this element. This will only be set when autoblocking code is used. |
Hint: You can add ?cmpnoblocking to the website URL in order to prevent the automatic blocking from being activated. This can help debugging situations when a blocked code results in unexpected behaviour.
You can add ?cmpnoblock=domain.com in order to prevent the automatic blocking from blocking explicitly "domain.com".
Hint: You can add ?cmpdebug to the website URL in order to get a more detailed output in the browser console.
