


Reporting
The ConsentManager CMP will create reports in order to allow you to get a better feeling on what is happening on your website.
Filter and grouping
In order to get the best overview, you can filter the data that is displayed to you. Therefore simply select the required options from the form:
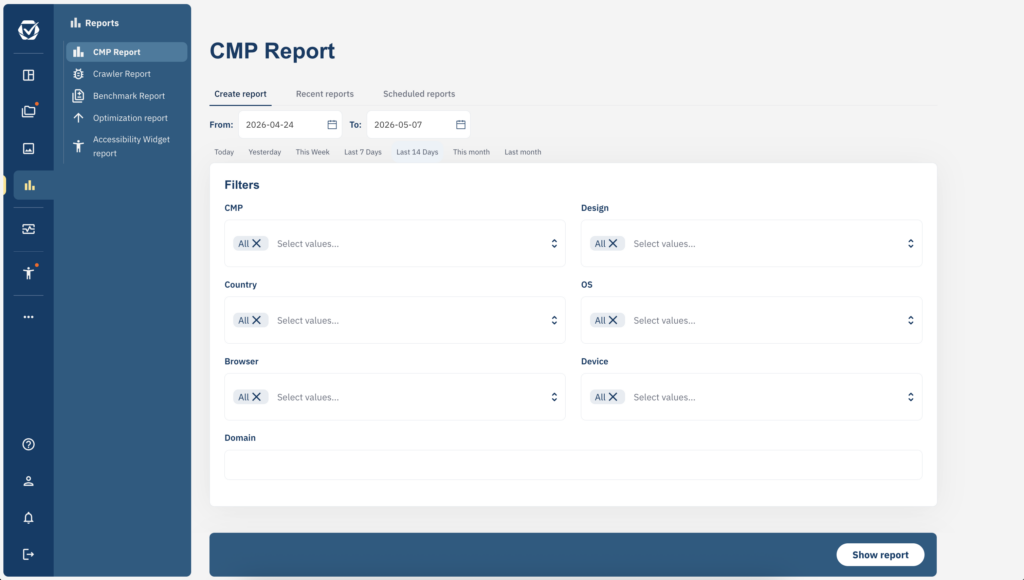
All dimensions can also be grouped. Simply tick the checkbox for the dimension that you like to group. All dimensions can be combined/grouped with all other dimensions.
Note
Depending on the grouping, some reported columns will appear empty. E.g. if you group by Design, the column "PageViews" will show a 0 (Zero) because the pageviews are not counted by design.
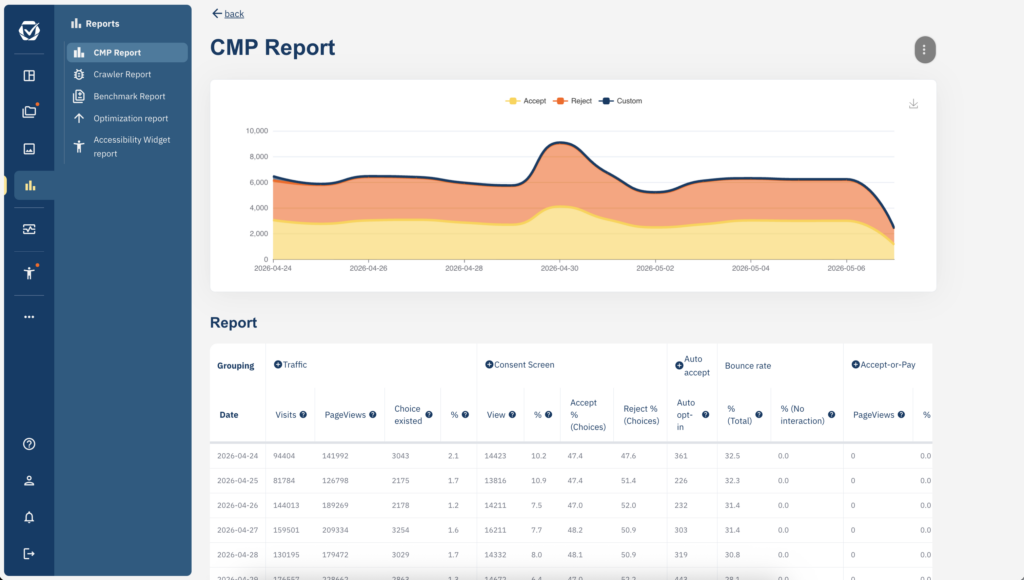
Metrics
Once the report is generated it will show the following metrics:
-
Traffic > Visits
Amount of visits (sessions) your website had. A session ends if a user is inactive for more than 2 hours.
-
Traffic > PageViews
Amount of PageViews your website had. See our definition of a page view. A pageview includes all times when our code was installed on your website, no matter on whether or not the consent layer was shown. -
Traffic > Choice existed
Amount of PageViews with pre-existing choice. As for unknown visitors the first page view will be used to show the consent layer, these number will usually only include pageviews 2, 3, 4, 5 ... of a visitor. -
Traffic > Accepted
Amount of PageViews with pre-existing choice where all options were accepted.
Traffic > Rejected
Amount of PageViews with pre-existing choice where all options were rejected. -
Traffic > Custom
Amount of PageViews with pre-existing choice where custom options were chosen. -
Traffic > Not necessary
Amount of PageViews where consent was not necessary (e.g. visitors outside of the EEA/EU and/or US/California). -
Traffic > Not possible
Amount of PageViews where a cosent layer should be shown (e.g. the visitor did not choose yet or the layer should be re-shown because of new settings) but the CMP decided to not show the consent screen (e.g. because the visitors browser did not support cookies or the visitor ignored the consent screen too often).
-
Consent Screen > View
Amount of on how often the consent screen was shown. This is not the same as the amount of visitors as a single visitor could ignore the consent layer and refresh the page several times (and so the number of consent screen shown would be counted multiple times). -
Consent Screen > Accept
Amount of consent screens being shown and the visitor clicked on the accept button.
% (Views) > Percentage based on all Consent Screen Views
% (Choices) > Percentage based on all choices made (Accept + Reject + Custom)
Accept (% Views) vs. Accept (% Choices)
The Accept rate measures the share of cookie banner impressions that end with a user clicking "Accept." You'll see it reported in two ways.
Accept (% Views)
Formula: (Accept ÷ Views) × 100
This is the absolute acceptance rate across every banner view, including users who didn't interact with the banner. It shows how your full audience responds to the consent screen.
A factor that strongly shapes this number is the Ignore rate, which counts users who saw the banner but made no choice:
Formula: (Views − Interactions) ÷ Views
When the Ignore rate is high, most users walked past the banner without clicking anything. That pulls Accept (% Views) down, since non-interacting users dilute the percentage.
Accept (% Choices)
Formula: (Accept ÷ (Accept + Reject + Custom)) × 100
This is the acceptance rate among users who actually interacted with the banner. Of the people who made a choice, it tells you the share that chose to accept.
-
Consent Screen > Reject
Amount of consent screens being shown and the visitor clicked on the reject button.
If you do NOT have a reject button in your design, then reject will only be counted if the user has deactivated ALL vendors (custom settings screen). -
Consent Screen > Custom
Amount of consent screens being shown and the visitor made a custom choice. -
Consent Screen > Ignored
Amount of consent screens being shown and the visitor did not make a choice. -
Consent Screen > Bounce rate
(Total) Percentage of PageViews on which a consent screen was shown and which lead the visitor to leave the website instead of continuing to surf on the website. The usual scenario for this would be a visitor coming to your website, the consent layer is shown and leaves the page (with or without making a choice before leaving).
(Active) Percentage of PageViews on which a consent screen was shown and which lead the visitor to leave the website instead of continuing to surf on the website. The usual scenario for this would be a visitor coming to your website, the consent layer is shown and leaves the page (without making a choice before leaving).
-
Auto-accept > Auto opt-in
Amount of PageViews where consent was automatically given based on auto opt-in rules (e.g. time-based auto-accept or scroll-based consent).
-
Auto-accept > Auto opt-out
Amount of PageViews where consent was automatically denied based on auto opt-out rules.
-
Accept-or-Pay > Click out
Amount of times visitors clicked on the external link/button to proceed with the payment or subscription option.
-
Accept-or-Pay > Login
Amount of times visitors successfully logged in or authenticated to access content without providing consent.
-
Accept-or-Pay > Abort
Amount of times visitors closed or dismissed the Accept-or-Pay screen without making a choice.
-
Accept-or-Pay > Bounce
Amount of times visitors left the website immediately after seeing the Accept-or-Pay screen without any interaction.
Exporting the report
In order to export the report, you can use the Export CSV link above the result table. If you like to export the report automatically, you can either use our API or copy the export link and add &kname=...&kpass=... the the link in order to authenticate. If you do so, please ensure not to give the link to any third party as it will contain your password in plain text.
Please note: Reporting details are only available for 45 days. After this, the report will only show grouped data by date and no longer by design/os/browser and so on.
FAQ
I'm using a design where the background of the page is hidden. How can there still be a high Ignore-Rate?
Hiding the website does not mean that a visitor cannot ignore the consent layer. Usualy an ignore rate can occur when:
- Visitor leaves the website
- Visitor is using an Ad-Blocker which hides the cookie banner
- Visitor presses the refresh button
- Visitor is a robot/crawler (robots simply ignore the consent layer and continue surfing on the website because they dont "see" the consent layer but the content below it)
Why is the ignore rate and the bounce rate different?
Bounce rate means that the visitor left the website - ignore only means that the visitor did not click a button on the consent layer. Visitors can continue to surf your website while ignoring the consent layer (see above).
Why does my Google Analytics account show different numbers than what consentmanager shows?
There are several reasons why an analytics tool would show different numbers:
- Differencies in visits are often due to the fact that different measurement periods are selected. consentmanager measures only visits (sessions) and not visitors.
- The use of ad blockers by visitors can cause that analytics and consentmanager count different numbers.
- If implemented correct, any analytics tool should only be active if consent is given. Hence it will automatically count less.
- Usually analytics tool will filter bot traffic much stronger than what consentmanager is filtering.
- Please also ensure to compare the right numbers (e.g. pageviews with pageviews and not pageviews with visits and so on)
